Category Archives: Cardiac Electrophysiology

Cardiac Electrophysiology

Action Potential Video

Some time ago, I can’t recall when, Maria mused about me making faces simulating the time course of an action potential spike from a cardiac cell.

Well, I’ve finally done it. The video is embedded below:

ADDENDUM: Had posting issues. This was supposed to be part of the post –

Here’s an example of what a plot of an action potential spike looks like:

action potential

Optical Mapping and Optical Coherence Tomography

In my last few posts, I’ve mentioned optical mapping and optical coherence tomography (OCT). Given just the names it’s not actually obvious that they’re entirely different things. Thus, I thought I should explain them.

Optical Mapping

“Optical Mapping” is short for something like “Optical mapping of voltage on the surface of the heart using fluorescence from potentiometric dyes”. The short version is ambiguous, as it could mean optical mapping of all kinds of stuff, and could in fact be synonymous with OCT. When cardiac electrophysiologists refer to an optical mapping study, what that usually involves is the following.

A heart is mounted in a clear chamber of some kind, and instrumented appropriately for whatever experiment is being done (say, defibrillation). A dye is then injected into the fluid flowing through the heart, typically “Tyrode’s” solution, which is kind of like blood without proteins and blood cells. This dye is fluorescent, meaning that when a certain color of light shines on it, it absorbs that light but then releases light of a different color. The cool (and useful) thing is that the amount of light released depends on the voltage gradient across the dye. It is designed to sit across the membrane of a cell, so by measuring changes in light released, it’s possible to measure changes in the electrical potential across the cell membrane, and to thereby monitor excitation, arrhythmia, and so on without electrodes. Using a fast, high-resolution camera, it is thereby possible to measure electrical activity in the heart from many more points, and at much better resolution, than using a bunch of electrodes. The major downside of optical mapping is that it is essentially limited to surfaces. Electrodes are still needed to probe the depths of the myocardium. Alternatively, optical mapping experiments can be combined with simulation experiments. We contend that if the sufrace activity of the simulation matches the suface activity of the experimental preparation “reasonably” well, the simulated activity within the walls should be a good approximation of what’s going on inside the experimental heart.

Optical Coherence Tomography

Typically referred to as OCT, the easiest way to explain it is that it’s like ultrasound imaging, but with light. In reality it gets a little more complicated. Wikipedia has a pretty good explanation. We’re using it to scan the thin right-ventricular free wall of the rabbit heart, and are then going to make and use computational models based on the resulting data. To do that, we have to segment the images (determine what is tissue, what is not), and then analyze them to create a finite element mesh.

Visiting St.Louis

I’m visiting St.Louis for the rest of this week to work with our collaborators on acquiring some OCT data. We’re imaging a right-ventricular free wall from a rabbit heart, on the endocardial side, as shown in this picture:

OCT Preparation of RV Endocardium

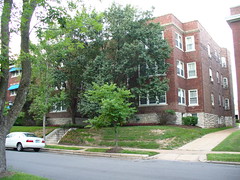
After we were done with work for the day, I took a walk over to the apartment building where most of our lab lived during the hurricane. It was really surreal. On the one hand, all of the Katrina Evacuation, the flooding, the return to New Orleans, etc… feels like a dream. Sometimes I almost believe it didn’t happen, though of course I know it did. And yet, here’s a reminder:

6823 Kingsbury Blvd - Our Home away from Home

We had some good times during our short stay there, and it helped to build camaraderie and cohesion in the lab. We had the whole top floor of that building (two floors) and once even made use of the roof. Shh, don’t tell Quadrangle Housing.

More on open science: PLoS ONE

I wrote last month about my desire for more open access in science, and how PLoS was leading the way. I also said I had some ideas about what more could be done.

It looks like PLoS ONE stole them.

Of course, I jest.

Obviously they’ve been working on this for a while, and I missed it. I only know about it because I’m now subscribed to their RSS feed. This is the framework upon which the future of science publishing will be built. There are many PLoS (Public Library of Science, by the way) journals — PLoS ONE seems to aim to be the open-access equivalent of Science or Nature.

Anyone is allowed to register and comment on or rate articles (with some caveats). They even have guidelines for rating articles. The initial review they mention by an editor and perhaps a few reviewers keeps out the quacks, but anyone is allowed to point out weaknesses in the article or make suggestions on it. It reverses my original idea a bit, in which the article would not be “published” until it had passed a vote by public reviewers, but it is perhaps a more functional model.

I am planning to register and see about reviewing and commenting on some articles. Are you?

Diagnosis Wenckebach

Okay, so this made the rounds a little while ago, but I’m posting it nonetheless:

Amanda and I had a little bit of a communication difficulty when discussing this video. Apparently in medical terminology, at least for a 4th-year medical student, “Wenckebach” is only heard when referring to intermittent AV-nodal block (as deftly illustrated in the video). On the other hand, experimental electrophysiologists frequently refer to any situation in which one area is activating more rapidly than an adjacent area because of differences in refractory period “Wenckebach rhythm”, or if they’re more precise, “Wenckebach-like rhythm”. Many synonyms are also used.

Below is a video of electrical activation during ischemia, illustrating a Wenckebach-like rhythm.

As you can see in the video, the center of the model is only activated every other beat, while the periphery is activated every beat. This is typically referred to as “2:1 capture” or “Wenckebach-like rhythm”, even though the actual phenomenon has very little to do with a true Wenckebach rhythm, in which the atria are activated more rapidly than the ventricles, with block occurring intermittently at the AV-node. The “Diagnosis Wenckebach” has some cute diagrams and even stadium-wave-like demonstrations of this phenomenon.